The Foot Tapping test is applied to assess the capabilities of the lower limb neuromuscular system in relationship to athletic performance.
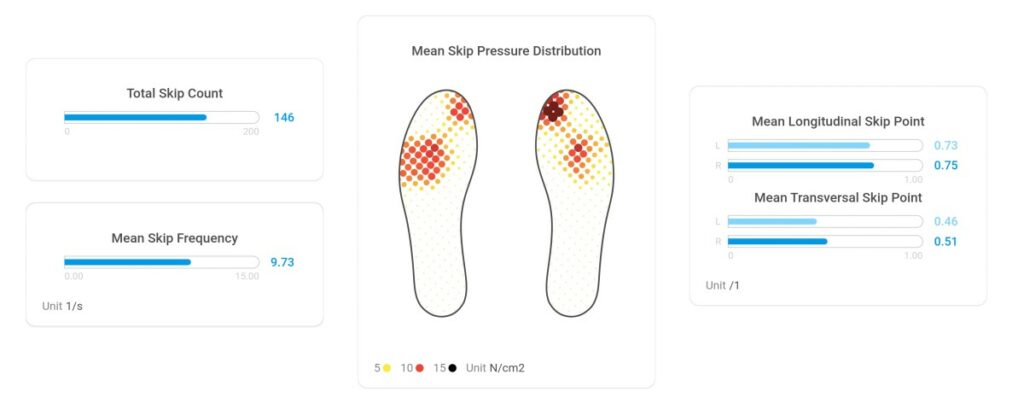
The main outcome parameter is Total Skip Count (Fig-1, top left). Mean Skip Frequency (Fig-1, bottom left), given in skips per seconds, results from the Total Skip Count. #

An example of a qualitative outcome parameter is the plantar pressure distribution (Fig-1, middle), averaged across all skips. In this example, there is a higher pressure peak in the area of the right big toe compared to the left.
Further numerical outcomes are Mean Longitudinal and Transversal Skip Point (Fig-1, right), which relate to the center of pressure (COP) of the foot on the floor in anterior-posterior and medio-lateral direction, respectively. Here, the skip point in longitudinal direction of both feet is similar, while it is shifted in the medial direction on the right compared to the left foot.
Fill out the form on the right to receive a PDF document which contains a complete parameter list and parameter descriptions. The document also contains the test description and additional information as indicated in the ReGo Foot Tapping article.