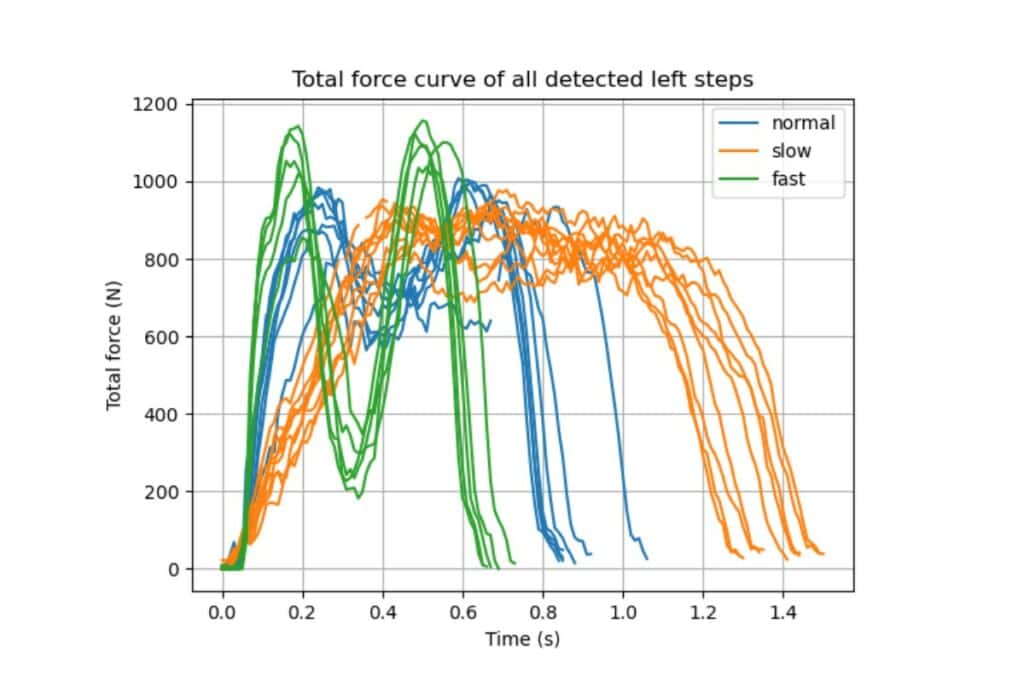
This article describes a full workflow for programmatically analyzing gait data collected using Moticon’s OpenGo Sensor Insoles, from the recording of data to the creation of a step analysis plot. We will see how 29 lines of Python code are sufficient to achieve the following: For walking data collected at three different speeds, plot the per-step total force curves for each of the walking speeds, separately.
Collecting and Analyzing Gait Data
We will use a Python script to work on text files exported from the OpenGo Software. The following functions of the OpenGo Software will simplify our processing pipeline:
- The text export automatically synchronizes the left and right side sensor insole data to a common time axis. As a result, we obtain a “tabular” output where each time point (= data row) has a left and right sensor insole data sample.
- By running the gait report, a step detection algorithm automatically detects step events, and stores these step events in a data channel along with the sensor insole data. The text export output will then contain the step event channels (for left and right, separately), so our Python script can make use of them.
Let’s get started! The required resources are summarized in the subsequent section.
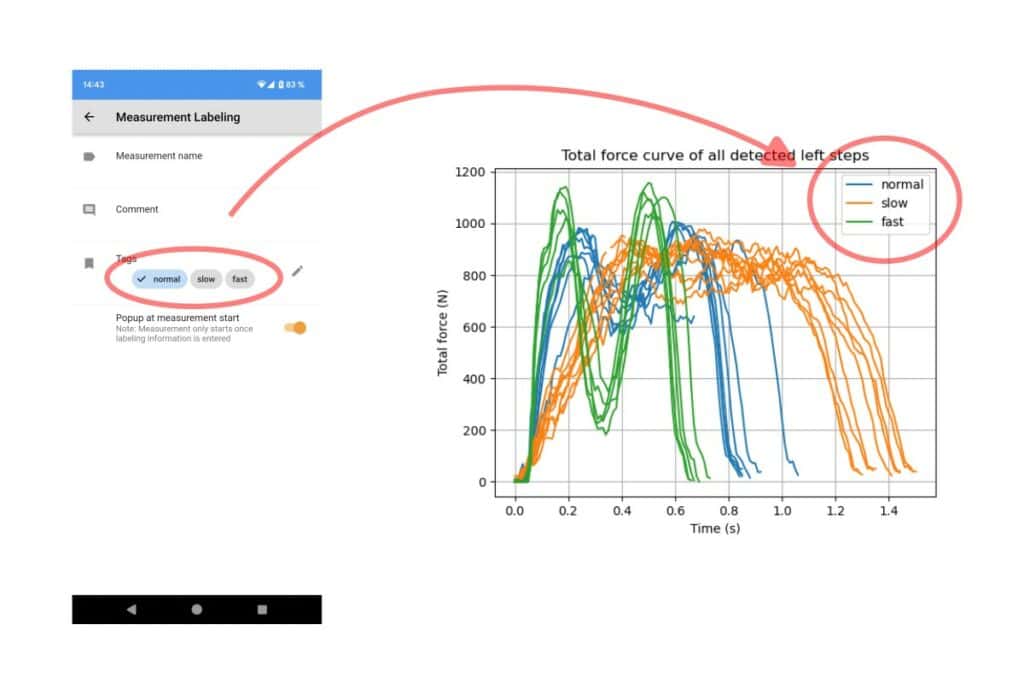
- First, collect some data of short walking trials. Using tags in the OpenGo App, we collect data of normal, slow, and fast walking in three separate measurements (see above screenshot).
- After recording a short trial for each of the walking speeds, we transfer the data from the OpenGo Sensor Insoles to the OpenGo Software. The tags can be seen in the Analyze screen’s listview in the column “Tag”.
- We use the gait report function (Report section) for automatically detecting steps. By selecting the root folder, the gait report runs on all measurements. The gait report output itself is not of interest here, just the detected steps.
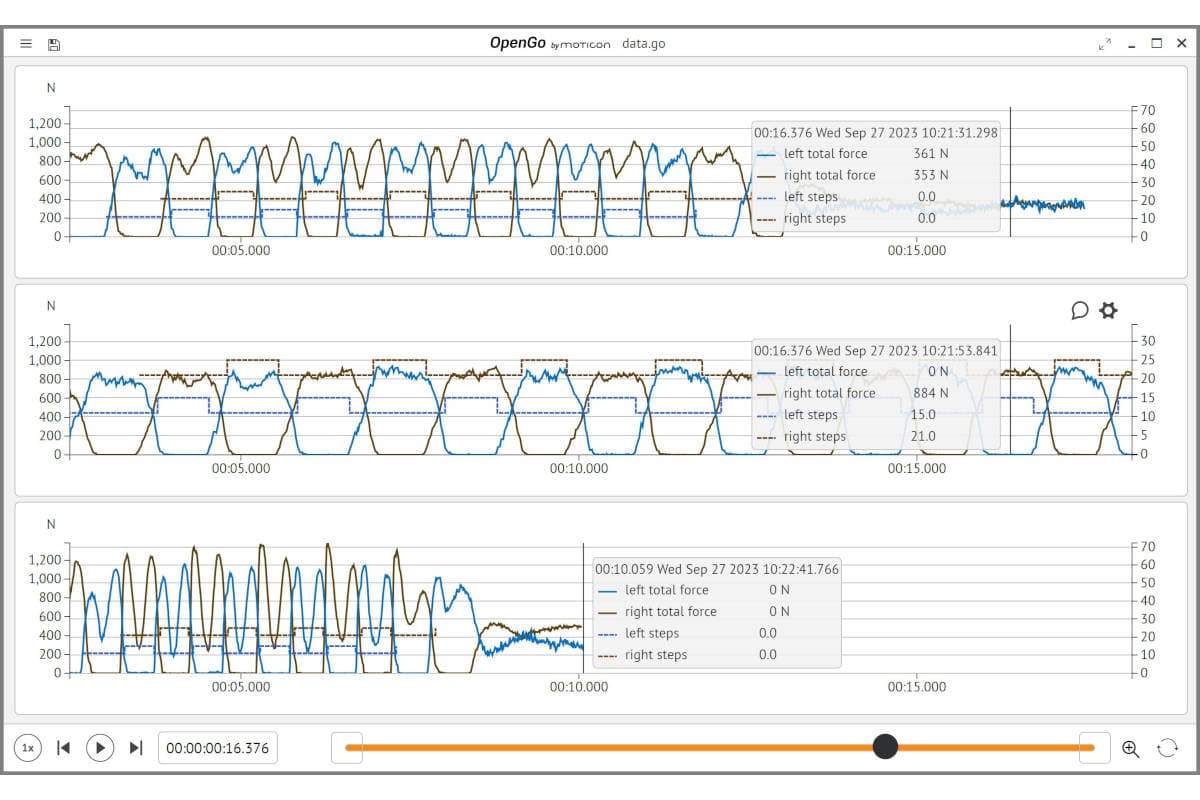
- To inspect the detected step events, turn on the “left steps” and “right steps” channels (under “Other”) in the line graph widget of the Analyze screen. The step events are encoded as integer values for left and right steps, separately. They are shown as dashed curves here:

- We can now export all data as text files (.txt), using the text export function of the Report section. The text files will also contain the detected step events as separate data channels (columns). Note: If a measurement is edited by the cut/crop tools, the step events are removed and the gait report must be re-run.
Let us now create a Python script in the same folder as the exported text files. With 29 lines of Python code, as shown in below Code Example 1, you can create the following diagram. It shows how the total force curve (in terms of its shape, duration, and force peaks) during the ground contact depends on the walking speed:
Required Resources
The above-described gait analysis workflow requires the following:
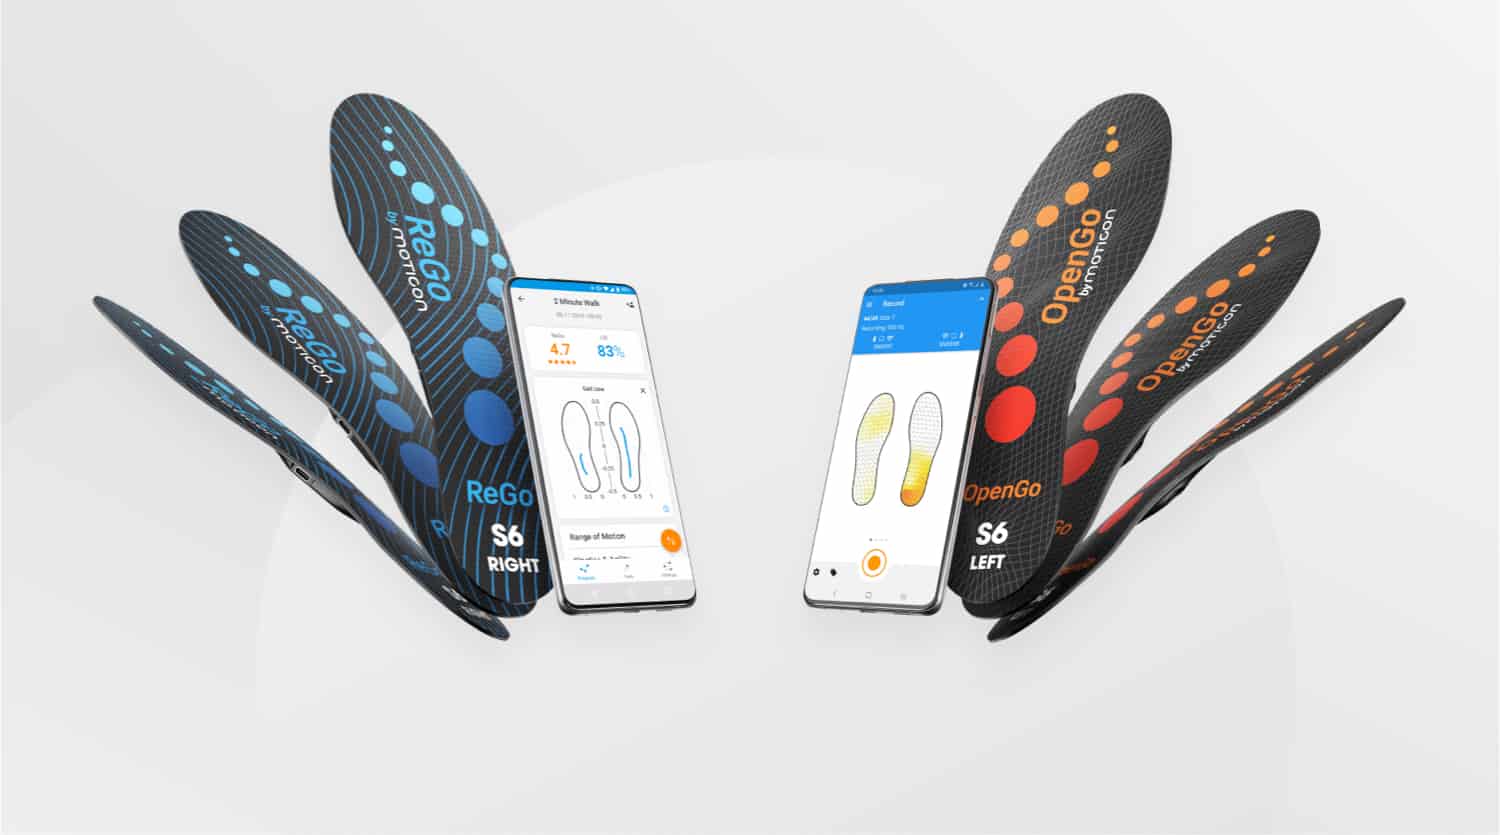
- Moticon OpenGo Sensor Insoles, OpenGo Software, and OpenGo App.
- Python installation and NumPy library. You could for example ask ChatGPT:
- [How to install Python and NumPy on a Windows PC, all downloaded from the official online resources? Provide an example with virtualenvs.](https://chat.openai.com/share/d24ba7d9-52a0-4cb0-afa4-fc7ea34dc98c)
- [How do I use Python notebooks in VS Code for beginner](https://chat.openai.com/share/528c8ebb-b048-4790-883f-11b2fa63f10b)
- If you are not familiar with version control but would like to use it, you could ask ChatGPT:
[How to install Git from the original Git website, start a local repository, check in a simple Python ‚hello world‘ script, and run it in the Git bash?](https://chat.openai.com/share/10ea7ec4-de10-434d-85a1-1491e570c035)
Benefits of script-based data analysis
With the workflow described above, we would like to encourage researchers with little programming experience to go from spreadsheets to Python scripts. This provides major benefits:
- Reproducibility: With spreadsheets, the cleaning of data, sequence extraction, computation of intermediate output, and calculation of final results (e.g. statistics) is hard to reproduce and document. In contrast, a script-based approach can read in the same raw input files each time the procedure is started, perform a chain of documented data processing steps, and provide plots and final statistics in one go. It is therefore transparent and easy to repeat.
- Project iterations and agility: Projects using a spreadsheet-based data analysis often wait with the data post-processing and analysis until the data collection phase has been completed. This comes with various drawbacks. In contrast, a script-based analysis supports the exact opposite: The script development can start with the first available (exploratory) dataset, and its results may even suggest an iteration of the experimental setup. Furthermore, the automation of repetitive tasks makes it much easier to follow different analysis paths in a shorter amount of time.
- Version control: Script-based analysis allows you to write code that can be version-controlled using tools like Git. This makes it easier to track changes, collaborate with others, and reproduce results. Different versions of the code can be re-applied whenever new/additional measurement data is available.
- Extensibility: You can easily extend script-based analysis by incorporating machine learning, statistical modeling, and other advanced techniques to gain deeper insights from your data. Follow-up projects can benefit from code created in previous work, and extensive software libraries tackling a scientific field can be built over time.
- Scalability: Script-based analysis can handle large datasets and complex analyses more efficiently than spreadsheets.